31. Scatter Plot
31.1. Description
The scatter plot is useful for illustrating relationships between pairs of continuous variables. This plot was developed to support plotting MPR (matched pair) data from the MET Point-Stat tool.
Note
This MET output data must first be reformatted into a format that can be read in by the scatter plot code. This reformatting was accomplished through the METdataio METreformat module. The reformatted data consists solely of MPR linetype data and all the column headers are labelled according to the MPR linetype column names specified in the Point-Stat section of the MET User’s Guide in Table 11.20 “Format information for SEEPS (Stable Equitable Error in Probability Space) output line type”. In addition to selecting the two continuous variables to plot, the points in the scatter plot are colored based on their value. These colors are determined by specifying a colormap in the user configuration file.
31.2. Example
31.2.1. Sample Data
The data is text output from the MET Point-Stat tool. The data is arranged in columnar format and reformatted by the METdataio METreformat module.
The sample data for creating the example scatter plot is available in the METplotpy repository, where the scatter plot tests are located:
$METPLOTPY_BASE/test/scatter/reformatted_data_for_scatter.data
$METPLOTPY_BASE is the directory where the METplotpy code is saved:
e.g.
/usr/path/to/METplotpy if the source code was cloned or forked from the Github repository
or
/usr/path/to/METplotpy-x.y.z if the source code was downloaded as a zip or gzip’d tar file from the Release link of the Github repository. The x.y.z is the release number.
Note
The MPR linetype data produced by the MET Point-Stat tool has been reformatted via the METdataio METreformat module.
31.2.2. Configuration Files
The scatter plot utilizes YAML configuration files to indicate where input data is located and to set plot attributes. YAML is a recursive acronym for “YAML Ain’t Markup Language” and according to yaml.org, it is a “human-friendly data serialization language”. It is commonly used for configuration files and in applications where data is being stored or transmitted. Two configuration files are required. The first is a default configuration file, scatter_defaults.yaml, which is found in the $METPLOTPY_BASE/metplotpy/plots/config directory. All default configuration files are located in the $METPLOTPY_BASE/metplotpy/plots/config directory. $METPLOTPY_BASE is base directory where the METplotpy source code has been saved. Default configuration files are automatically loaded by the plotting code and do not need to be explicitly specified when generating a plot. In addition, the default configuration file DOES NOT require any modifications.
The second required configuration file is a user-supplied “custom” configuration file. This file is used to customize/override the default settings in the scatter_defaults.yaml file. The custom configuration file can contain only those settings that will override the default settings in the scatter_defaults.yaml config file.
Note
The YAML configuration files do not support expanding environment variables. If you see an environment variable referenced in this documentation for a YAML configuration item, please be aware the full value of that environment variable must be used.
31.3. METplus Configuration
31.3.1. Default Configuration File
The following is the mandatory, scatter_defaults.yaml configuration file, which serves as a good starting point for creating a scatter plot. This default config file SHOULD NOT be modified. The custom configuration file is used to override the settings of interest (i.e. marker colors, marker styles, trendline styles, etc.).
Note
This default configuration file is automatically loaded by scatter.py.
caption_align: 0.0
caption_col: '#333333'
caption_offset: 3
caption_size: 0.8
caption_weight: 1

dump_points: 'False'
fcst_var: TMP
fixed_vars_vals_input: {}
grid_col: '#f5274a'
grid_lty: 3
grid_lwd: 1
grid_on: 'True'
indy_stagger_1: 'False'
indy_vals: []
indy_var: ''
legend_box: o
legend_ncol: 3
legend_size: 0.8
legend_inset:
  x: 0.0
  y: -0.25
log_filename: stdout
log_level: ERROR
mar:
- 8
- 4
- 5
- 4
# Supported symbols: ., o, ^, d, H, or s (d=diamond, H=hexagon, s=square)
marker_symbol: .
# Colors for the range of values (colormap) for variable of interest (variable_val_by_color).
marker_colormap: 'gist_ncar'
marker_size: 5
points_path: ./
plot_caption: 'Caption for scatter plot'
plot_filename: ./scatter_default.png
plot_height: 8.5
plot_width: 11.0
show_legend: 'True'
show_trend_line: 'False'
start_from_zero: 'False'
stat_input: ../../../test/scatter/scatter.data
title: test title
title_align: 0.5
title_offset: -2
title_size: 1.4
title_weight: 2.0
user_legend: []
var_val_x_axis: FCST
var_val_y_axis: OBS
xaxis: test x_label
xaxis_reverse: 'False'
xlab_align: 0.5
xlab_offset: 2
xlab_size: 1
xlab_weight: 1
xlim: []
xtlab_horiz: 0.5
xtlab_orient: 1
xtlab_size: 1
yaxis: test y_label
ylab_align: 0.5
ylab_offset: -2
ylab_size: 1
ylab_weight: 1
ylim: []
ytlab_horiz: 0.5
ytlab_orient: 1
ytlab_size: 1


# Not used by the scatter plot, but needed to satisfy the base config class
plot_units: in
plot_res: 72
In the default config file, logging is set to stdout and the log level is ERROR (i.e. any log messages of type ERROR will be logged). If the log_filename and log_level are not specified in the custom configuration file, these settings will be used.
To save the log to a file and change the log level, set the log_filename and log_level to the desired values in the custom config file. DO NOT modify the default configuration file.
31.3.2. Custom Configuration File
A second, mandatory configuration file is required, which is used to customize the settings to the scatter plot. The test_scatter_mpr.yaml file is included with the source code.
caption_align: 0.4
caption_offset: 2.88
caption_size: 6
dump_points: True
points_path:  ./output/
var_val_x_axis: fcst
var_val_y_axis: obs
fcst_var: TMP

fixed_vars_vals_input:
  interp_mthd:
    - NEAREST
  fcst_lev:
    - P900-750
grid_col: '#f5274a'
grid_on:  True
indy_stagger: False
legend_box: o
legend_ncol: 3
legend_size: 0.8
log_filename: './output/scatter_log.txt'
log_level: INFO
# Supported symbols: ., o, ^, d, H, or s (^= triangle, d=diamond, H=hexagon, s=square)
marker_symbol: .
# Colors for the range of values (colormap) for variable of interest (variable_val_by_color).
marker_colormap: 'nipy_spectral'
marker_size: 6
plot_caption: 'optional caption'
plot_filename: ./output/scatter_mpr_tmp_obs_lat.png
plot_height: 8.5
plot_width: 11.0
show_legend: True
show_trendline: True
start_from_zero: False
stat_input: ./reformatted_data_for_scatter.data
title: "MPR usecase data for TMP, P900-750"
title_align: 0.5
title_offset: -2
title_size: 1.4
title_weight: 2.0
trendline_color: '#999999'
trendline_linestyle: '.'
trendline_width: 1
#user_legend: ["obs_lat from MPR data"]
user_legend: []
variable_val_by_color: obs_lat
xaxis: 'FCST'
xlab_align: 0.5
xlab_offset: 2
xlab_size: 1
xlab_weight: 1
xtlab_horiz: 0.5
xtlab_orient: 1
xtlab_size: 1
yaxis: 'OBS'
ylab_align: 0.5
ylab_offset: -2
ylab_size: 1
ylab_weight: 1
ytlab_horiz: 0.5
ytlab_orient: 1
ytlab_size: 1
Copy this custom config file from the directory where the source code was saved to the working directory:
cp $METPLOTPY_BASE/test/scatter/test_scatter_mpr.yaml $WORKING_DIR/custom_scatter.yaml
Modify the stat_input setting in the $METPLOTPY_BASE/test/scatter/custom_scatter.yaml file to explicitly point to the $METPLOTPY_BASE/test/scatter directory (where the custom config files and sample data reside). Replace the relative path ./scatter.data with the full path $METPLOTPY_BASE/test/scatter/scatter.data (including replacing $METPLOTPY_BASE with the full path to the METplotpy installation on the system).
Modify the plot_filename setting to point to the output path where the plot will be saved, including the name of the plot.
For example:
stat_input: /username/myworkspace/METplotpy/test/scatter/reformatted_data_for_scatter.data
plot_filename: /username/working_dir/output_plots/scatter.png
This is where /username/myworkspace/METplotpy corresponds to $METPLOTPY_BASE and /username/working_dir corresponds to $WORKING_DIR. Make sure that the $WORKING_DIR directory that is specified exists and has the appropriate read and write permissions. The path listed for plot_filename may be changed to the output directory of one’s choosing. If this is not set, then the plot_filename setting specified in the $METPLOTPY_BASE/metplotpy/plots/config/scatter_defaults.yaml configuration file will be used.
To save the intermediate plot_points.txt file, set the dump_points setting to True.
Modify the points_path setting or add it (if it doesn’t exist).
dump_points: ‘True’
points_path: ‘/dir_to_save_plot_points_file’
Replace the /dir_to_save_plot_points_file to the same directory where the plot_points.txt file is saved. Make sure that this directory has the appropriate read and write permissions.
To save the log output to a file, uncomment the log_filename entry and specify the path and name of the log file. Select a directory with the appropriate read and write privileges.
To modify the verbosity of logging than what is set in the default config file, uncomment the log_level entry and specify the log level (debug and info are higher verbosity, warning and error are lower verbosity).
31.4. Run from the Command Line
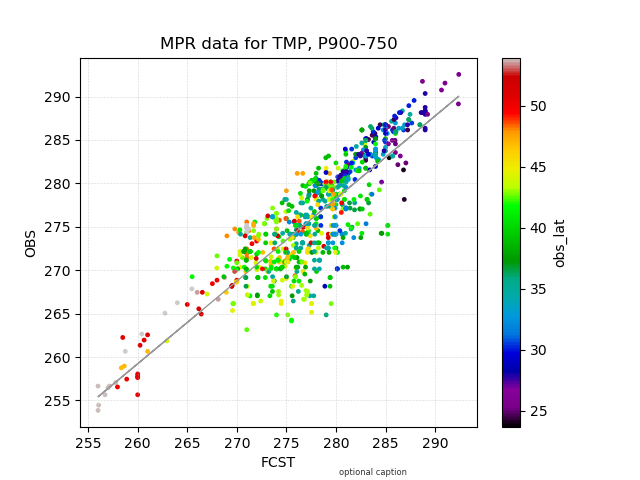
The custom_scatter.yaml configuration file, in combination with the scatter_defaults.yaml configuration file, generates a plot of the matched pair (MPR) linetype data for the TMP variable and the two continuous variables FCST and OBS.
The data has been further filtered based on the interpolation method and forecast level ( via the fixed_vars_vals_input setting).
The grid lines and trendline are turned on, the FCST, OBS, and OBS_LAT points are saved to a text file, and the OBS_LAT points are colored by their values using a colormap:
To generate the above plot using the scatter_defaults.yaml and custom_scatter.yaml config files, perform the following:
If using the conda environment, verify the conda environment is running and has the required Python packages outscatterd in the requirements section.
Set the METPLOTPY_BASE environment variable to point to $METPLOTPY_BASE.
For the ksh environment:
export METPLOTPY_BASE=$METPLOTPY_BASE
For the csh environment:
setenv METPLOTPY_BASE $METPLOTPY_BASERecall that $METPLOTPY_BASE is the directory path indicating where the METplotpy source code was saved.
Enter the following command:
python $METPLOTPY_BASE/metplotpy/plots/scatter/scatter.py $WORKING_DIR/custom_scatter.yamlA scatter_mpr_tmp_obs_lat.png output file will be created in the directory specified in the plot_filename configuration setting in the scatter.yaml config file.