7.2. Model Applications
7.2.1. Air Quality and Composition
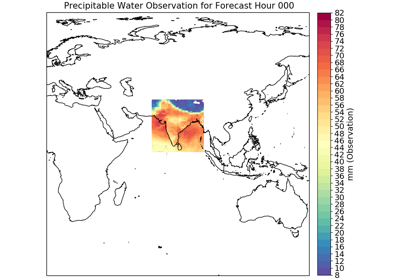
Data related to all areas of atmospheric composition, including ozone, smoke, dust, AOD and PM2.5
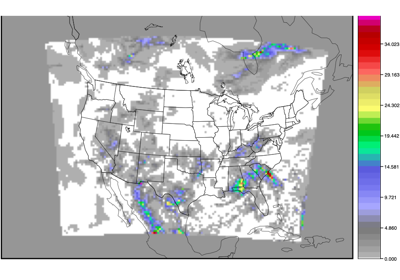
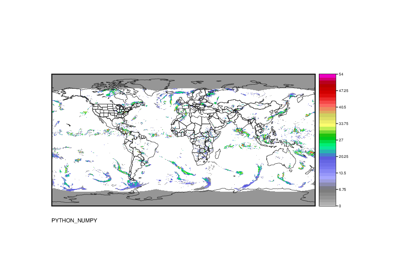
EnsembleStat: Using Python Embedding for Aerosol Optical Depth
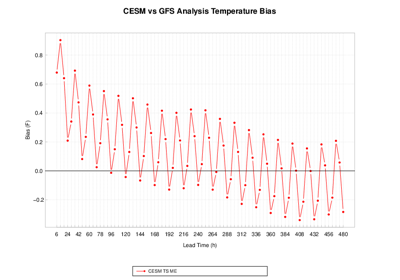
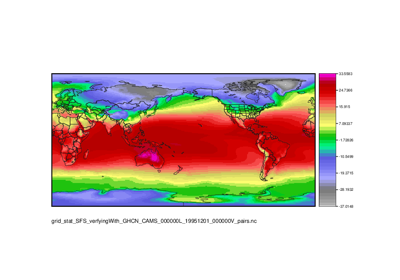
7.2.2. Climate
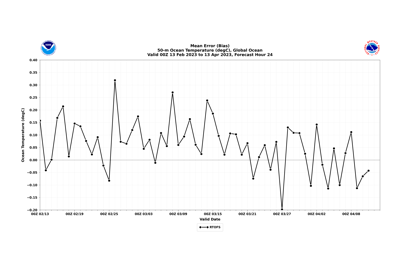
Average long range earth system predictions
7.2.3. Clouds
A category for use cases interested in the composition of, or characteristics associated with, clouds
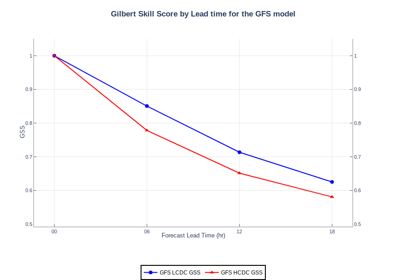
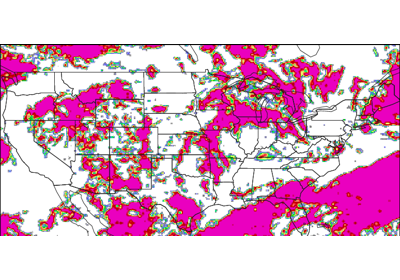
Grid-Stat, MODE, Stat-Analysis, UserScript, Gen-Vx-Mask: GFS Cloud Statistics by Type
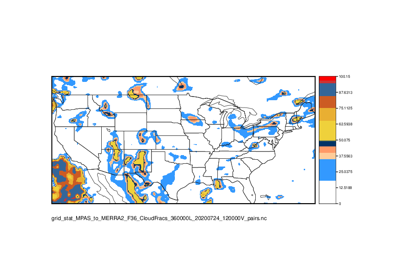
GridStat: Cloud Fractions Using MPAS and MERRA2 Data
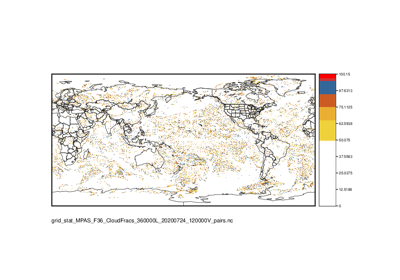
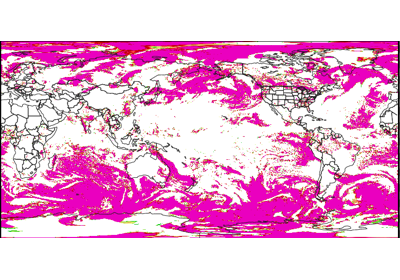
GridStat: Cloud Fractions Using MPAS and SatCORPS Data
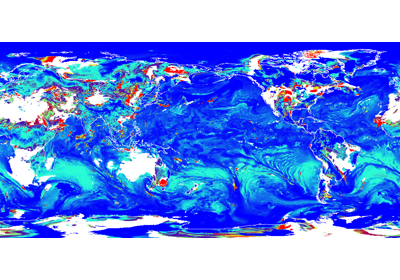
GridStat: Cloud Fractions Using GFS and MERRA2 Data
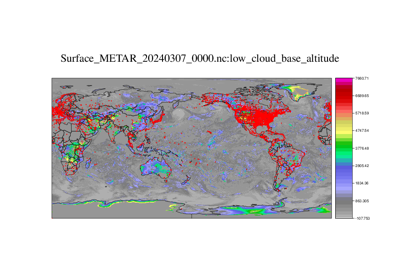
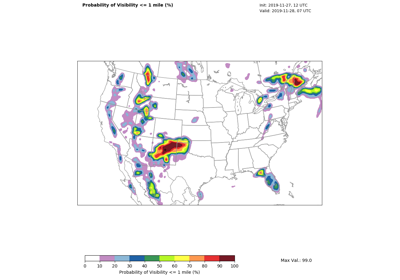
PointStat: Python embedding for ASOS/METAR cloud obs to verify GFS
GridStat: Cloud Height with Neighborhood and Probabilities
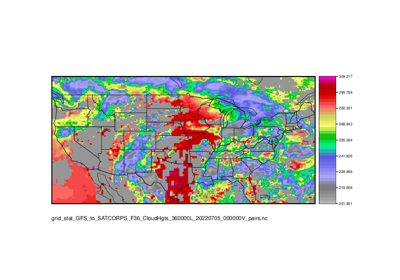
GridStat: GFS Cloud Pressure and Temperature Heights vs GOES
7.2.4. Data Assimilation
Observational data used as part of the initial conditions for numerical weather prediction
7.2.5. Fire
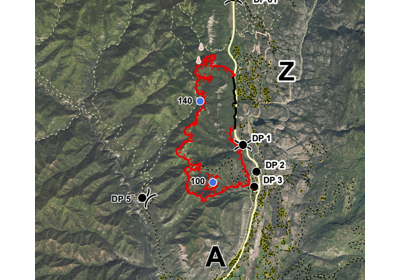
Verification of fire weather-related atmospheric parameters and fire spread models
7.2.6. Land Surface
Land Model diagnostics and verification against observations
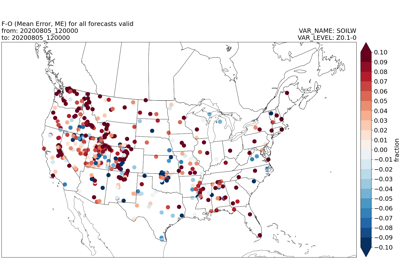
PointStat: Verify UFS Soil Moisture and Temperature with ISMN Observations
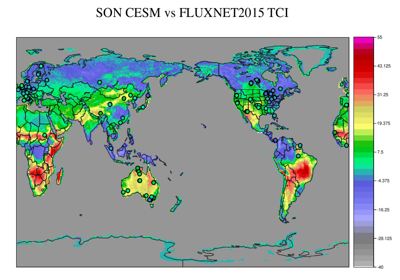
PointStat: CESM and FLUXNET2015 Terrestrial Coupling Index (TCI)
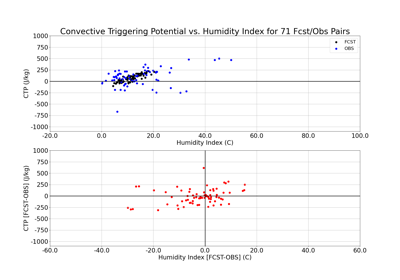
PointStat: Use Python embedding and METcalcpy to calculate and verify CTP/HI
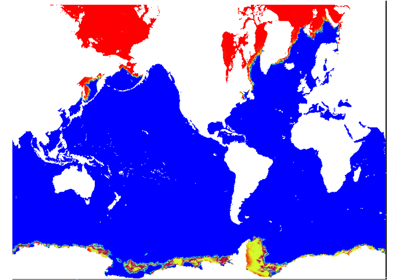
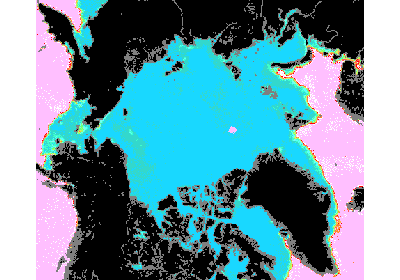
7.2.7. Marine and Cryosphere
Data related to verification involving marine and cryosphere systems, which includes sea-ice
PlotDataPlane: Python Embedding of tripolar coordinate file
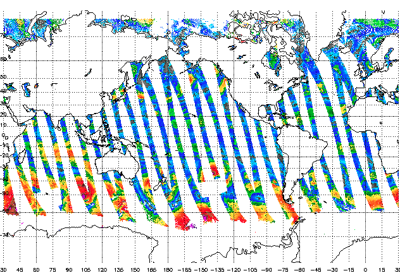
PointStat: read in directory of ASCAT files over user-specified time
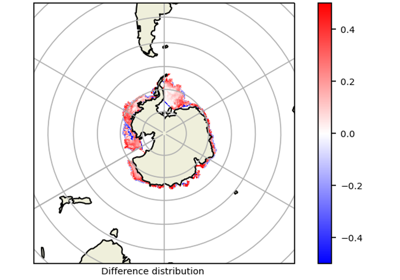
GridStat: Python Embedding to read and process ice cover
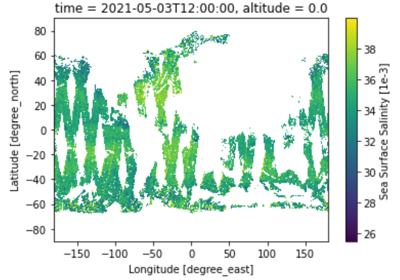
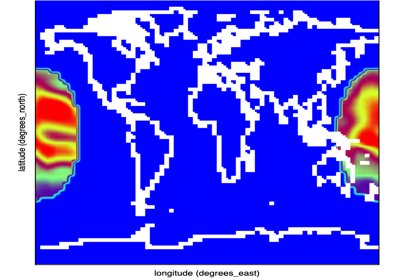
GridStat: Python Embedding for sea surface salinity using level 3, 1 day composite obs
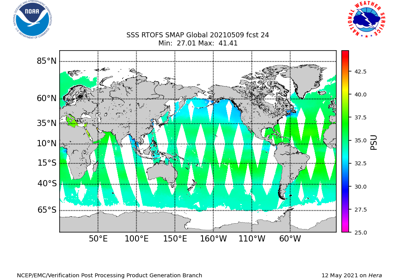
GridStat: Python Embedding for sea surface salinity using level 3, 8 day mean obs
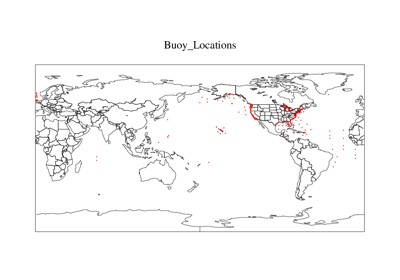
PointStat: read in buoy ASCII files to compare to model wave heights
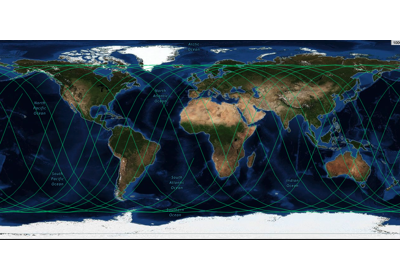
PointStat: read in satellite data and verify wind speeds or wave heights
UserScript: Python Script to compute cable transport
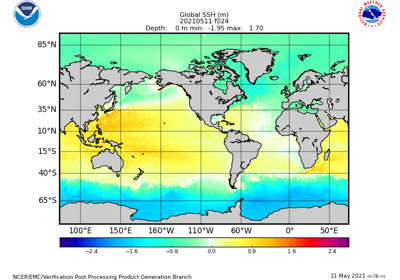
GridStat: Python Embedding to read and process sea surface heights
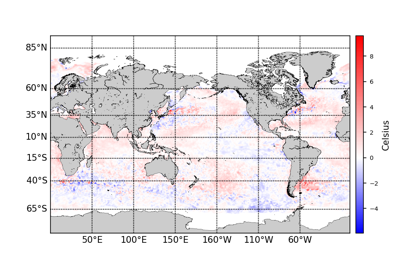
GridStat: Python Embedding to read and process SST
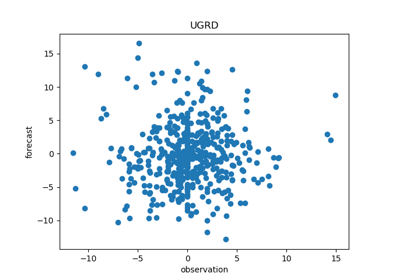
7.2.8. Medium Range
Lower resolution model configuration (>4km) usually producing forecasts out to 5-14 days (also referred to as global models)
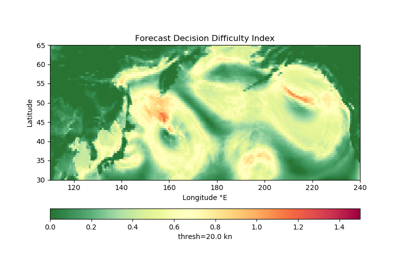
GridStat: Use binary observation field to verify percentile forecast
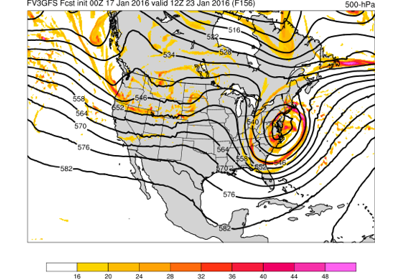
Multi_Tool: Feature Relative by Lead using Multiple User-Defined Fields
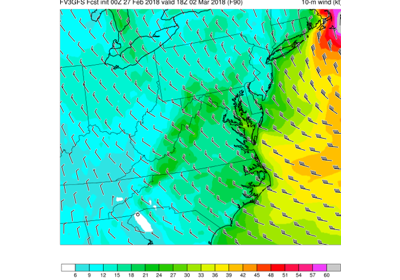
Point-Stat: Standard Verification for CONUS Surface
Multi_Tool: Feature Relative by Lead (with lead groupings)
Point-Stat: Standard Verification of Global Upper Air
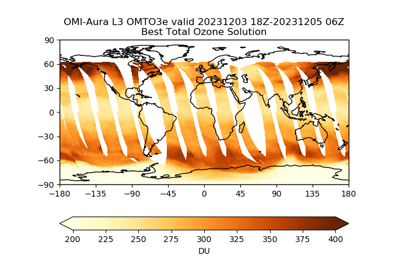
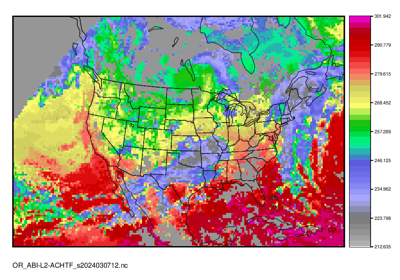
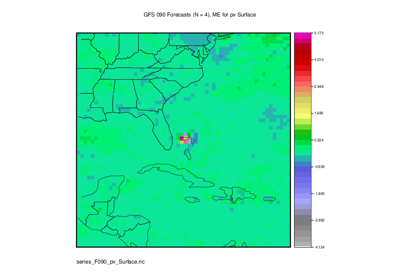
Grid-Stat: Using Python Embedding for Total Column Ozone


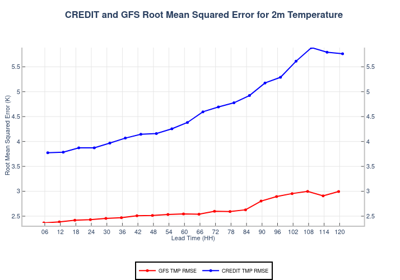
Grid-Stat, Stat-Analysis, Data-Ingest: CREDIT and GFS statistics and Data Download
Grid-Stat: Compute Anomaly Correlation using Climatology
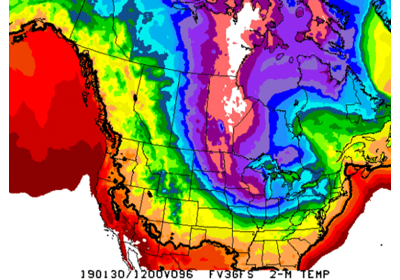
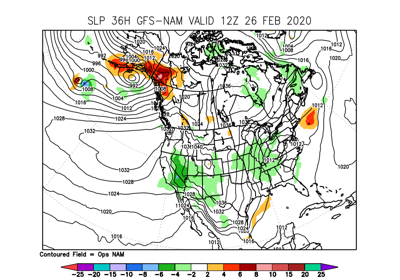
Grid-Stat: Standard Verification of Surface Fields
Multi_Tool (MTD): Feature Relative by Lead (with lead groupings)
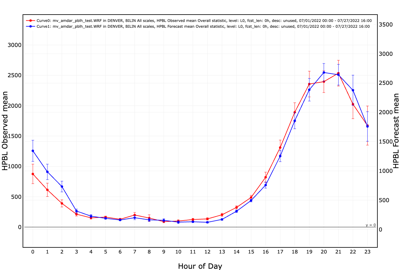
7.2.9. Planetary Boundary Layer
Planetary Boundary Layer (PBL) applications
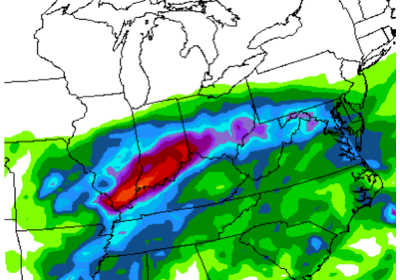
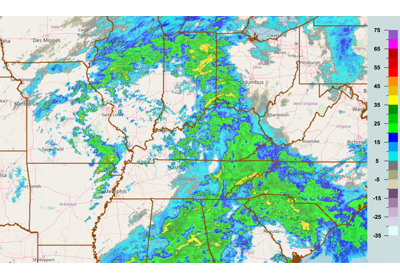
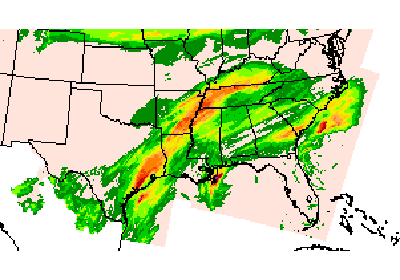
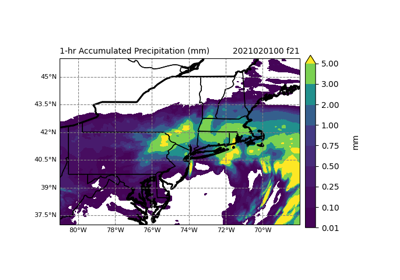
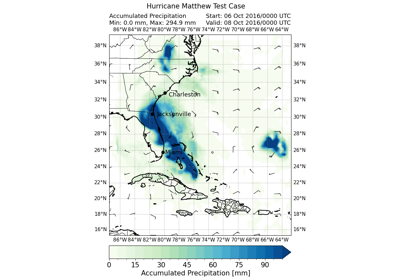
7.2.10. Precipitation
Any fields that can be defined as precipitation, including rain, snow, and other precipitation types

MTD: Build Revision Series to Evaluate Forecast Consistency
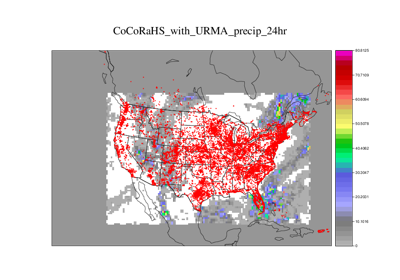
PointStat: Compare community observed precipitation to model forecasts
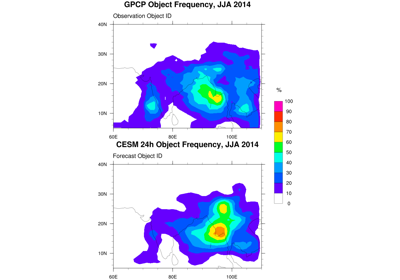
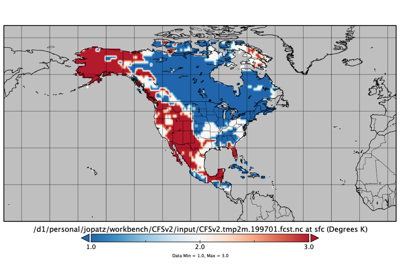
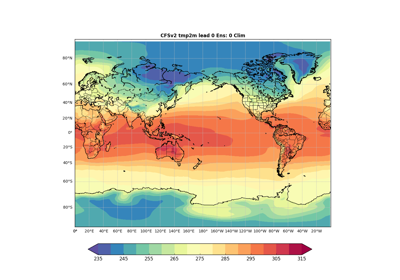
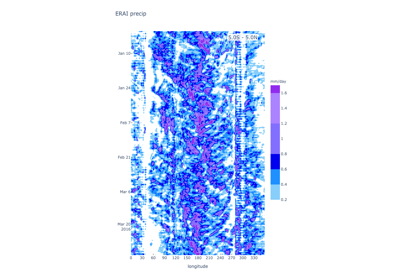
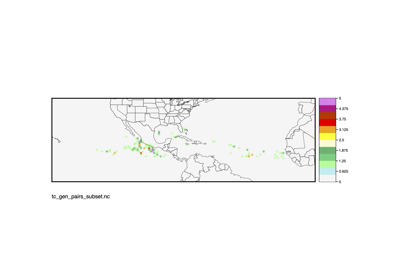
7.2.11. Subseasonal to Seasonal
Subseasonal-to-Seasonal model configurations; Lower resolution model configurations (>4km) usually producing forecasts out beyond 14 days and up 1 year
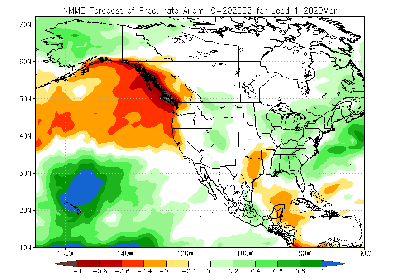
Grid-Stat and Series-Analysis: BMKG APIK Seasonal Forecast
GridStat: Determine dominant ensemble members terciles and calculate categorical outputs
SeriesAnalysis: Standardize ensemble members and calculate probabilistic outputs
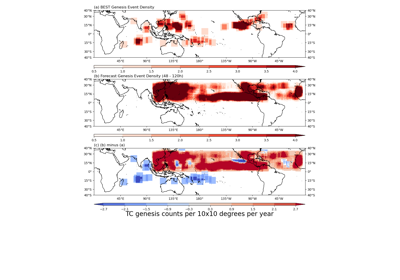
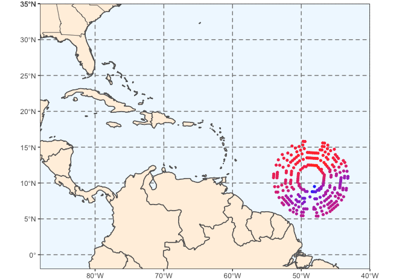
TCGen: Genesis Density Function (GDF) and Track Density Function (TDF)
GridStat: Apply separate climatologies for forecast and observations
7.2.12. Subseasonal to Seasonal: Mid-Latitude
Subseasonal-to-Seasonal model configurations relating to middle latitudes
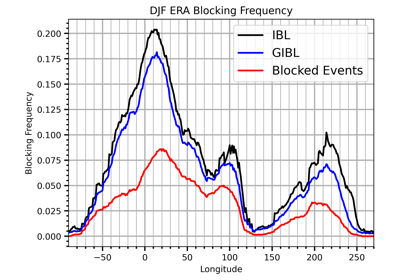
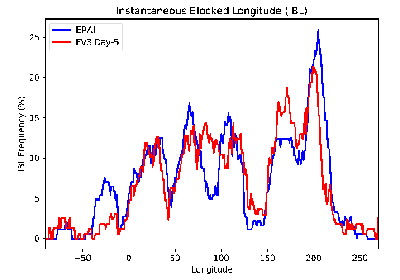
UserScript and StatAnalysis: Calculate and evaluate Blocking for the GFS and ERA
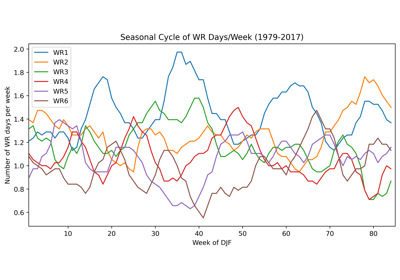
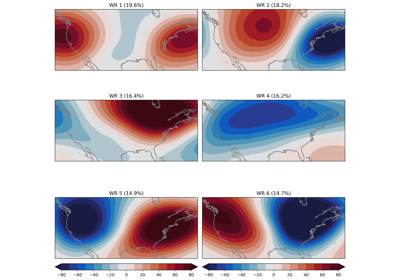
UserScript and StatAnalysis: Calculate and Evaluate Weather Regimes for GFS and ERA
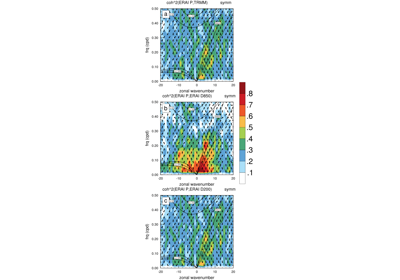
7.2.13. Subseasonal to Seasonal: Madden-Julian Oscillation
Subseasonal-to-Seasonal model configurations relating to the Madden-Julian oscillation
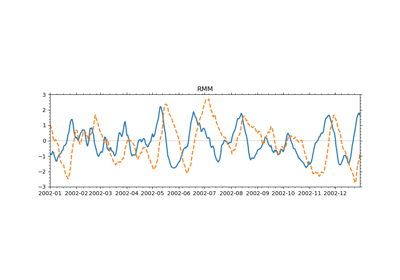
UserScript: Make ERA RMM plots from calculated MJO indices
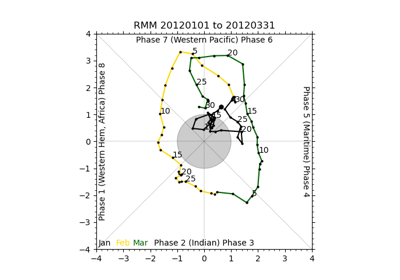
UserScript: Make a Phase Diagram plot from input RMM or OMI
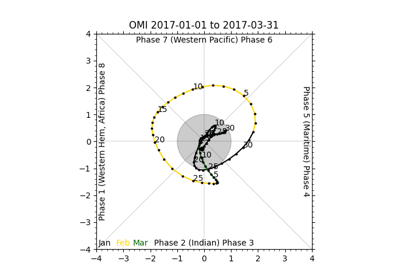
UserScript: Make GFS and ERA OMI plot from calculated MJO indices
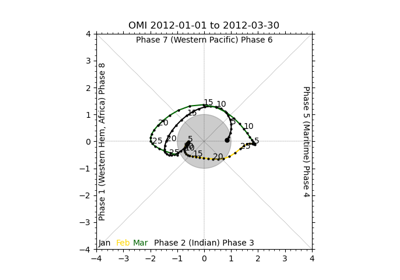
UserScript: Make ERA OMI plot from calculated MJO indices
UserScript: Make MaKE-MaKI plot from calculated MaKE and MaKI indices
7.2.14. Subseasonal to Seasonal: Soil Moisture
Subseasonal-to-Seasonal model configurations for Soil Moisture evaluation
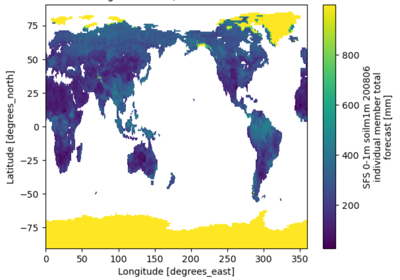
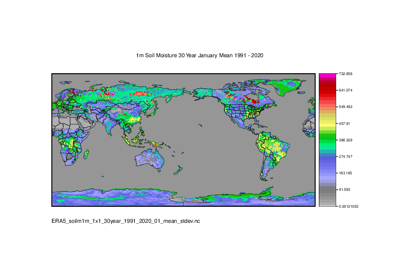
PCP-Combine: Compute 1m Soil Moisture and 30 year Climatology
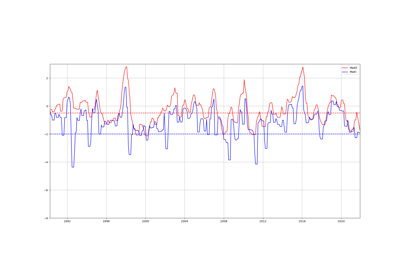
7.2.15. Subseasonal to Seasonal: Stratosphere
Subseasonal-to-Seasonal model configurations for Stratosphere evaluation

UserScript and StatAnalysis: Compute Polar Cap Temperature and Polar Vortex U and Create Plots
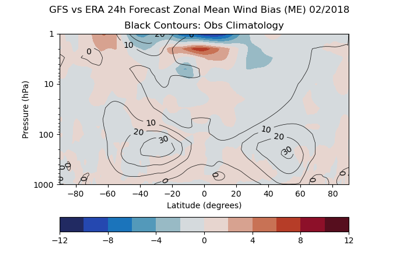
UserScript and SeriesAnalysis: Compute Zonal Mean Bias and Create Plots for Temperature and Wind
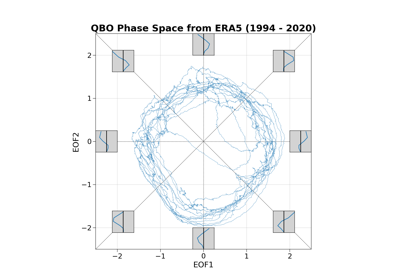
UserScript and StatAnalysis: Compute QBO Phase Plots and QBO Index
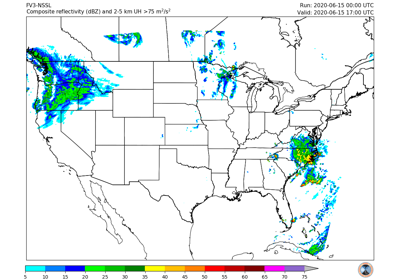
7.2.16. Short Range
High resolution model configurations (1-4km) usually producing forecasts between 0-3 days (also referred to as limited area models, stand-alone regional, and short range weather applications); Previously named Convection Allowing Models
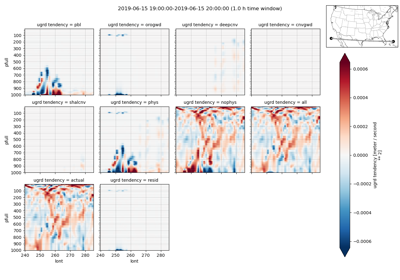
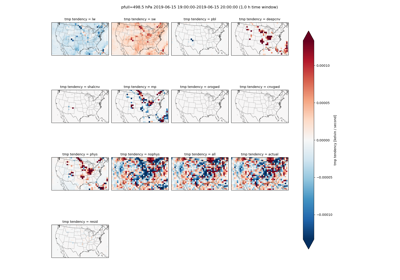
UserScript: Physics Tendency Vertical Cross Section plot
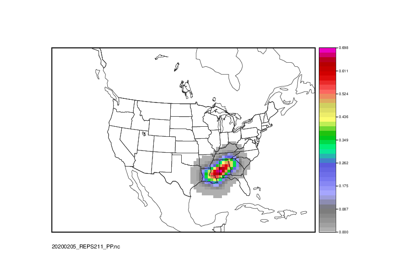
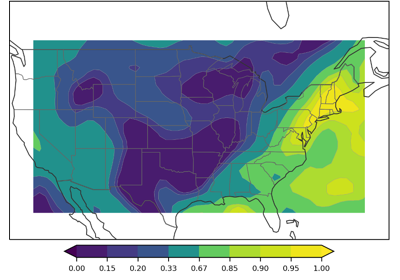
Point2Grid: Calculate Practically Perfect Probabilities
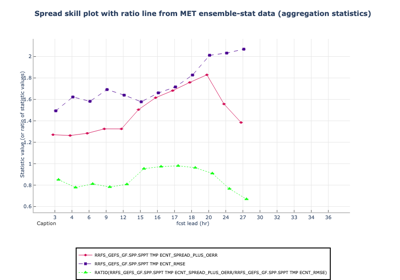
Ensemble-Stat: Ensemble Statistics using Obs Uncertainty

Grid-Stat: Surrogate Severe and Practically Perfect Probabilistic Evaluation
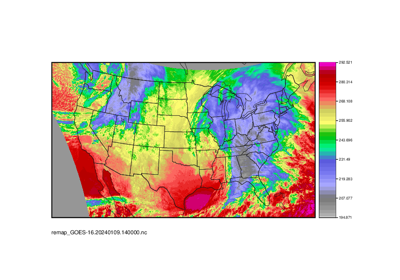
GridStat: Use Python embedding to evaluate GeoTIFF imagery across multiple fields
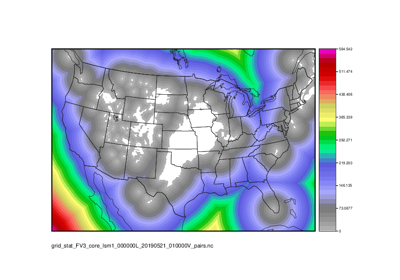
MODEMultivar: Create objects of brightness temps and radar reflectivity
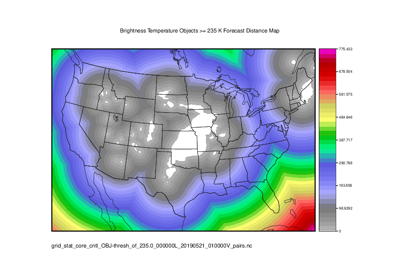
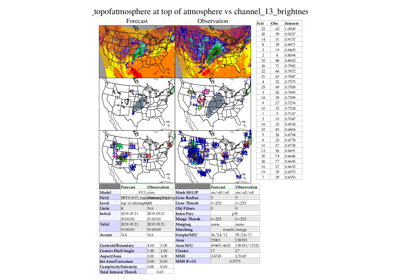
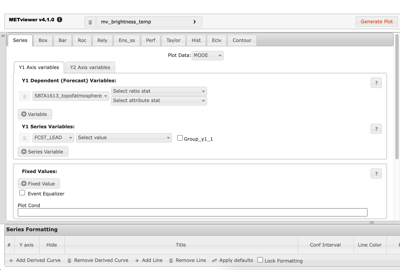
MODE/Grid-Stat: Brightness Temperature Verification and Distance Maps
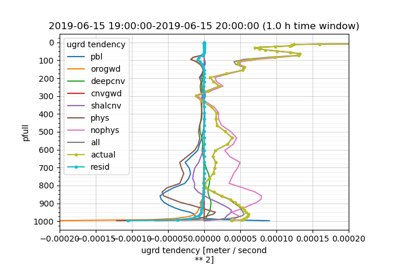
UserScript: Physics Tendency Vertical Profile plot
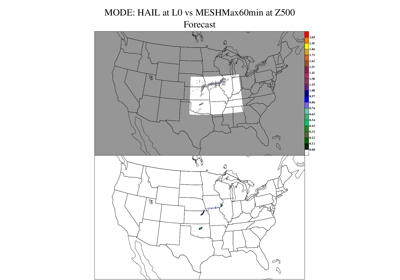
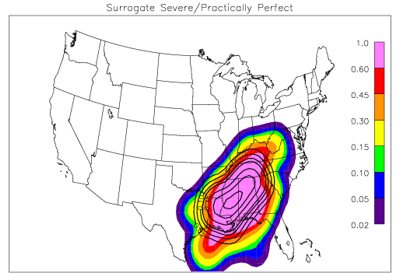
Grid-Stat: Surrogate Severe and Practically Perfect Evaluation
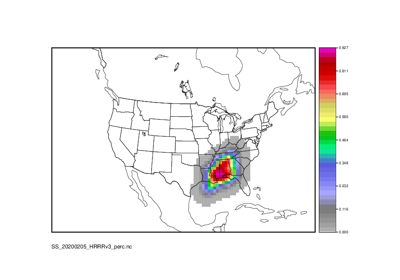
Surrogate Severe Calculation: PCPCombine, GenEnsProd, and RegridDataPlane
7.2.17. Space Weather
Upper atmosphere and geospace model configurations
7.2.18. Tropical Cyclone and Extra Tropical Cyclone
Any field that is associated with Tropical Cyclone and Extra-tropical Cyclones
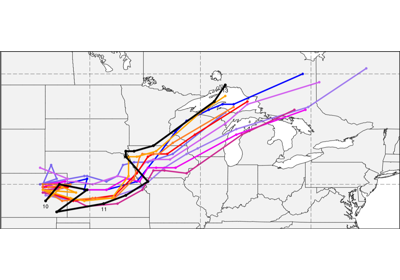
CyclonePlotter: Extra-TC Tracker and Plotting Capabilities
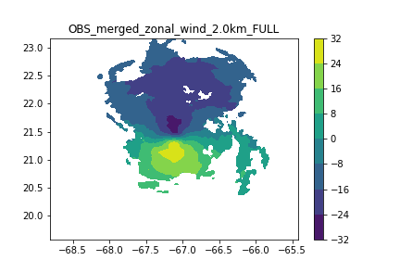
Grid-Stat: Verification of TC forecasts against merged TDR data
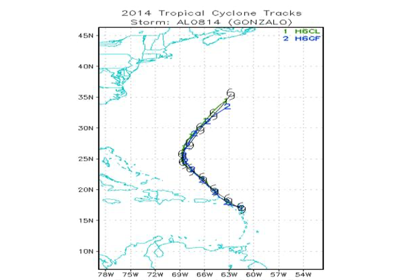

CycloneVerification: TC Verification Compare ADECK vs BDECK
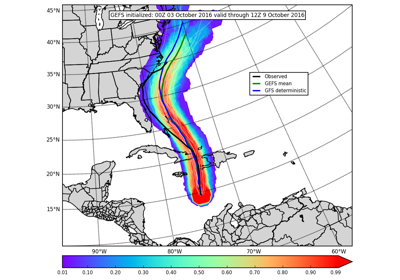
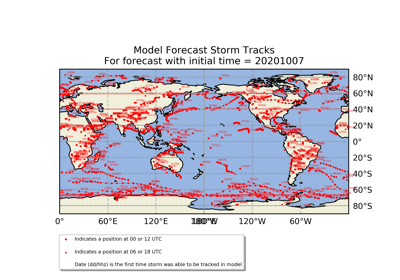
TCGen: 2021 Global Forecast System (GFS) Tropical Cyclone Genesis Forecast
Point-Stat: Standard Verification for CONUS Surface
7.2.19. Unstructured Grids
Unstructured grids used by models for numerical weather prediction.