7.2. Model Applications
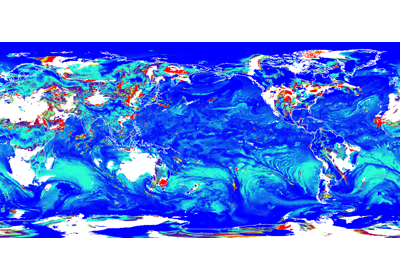
7.2.1. Air Quality and Composition
Data related to all areas of atmospheric composition, including ozone, smoke, dust, AOD and PM2.5
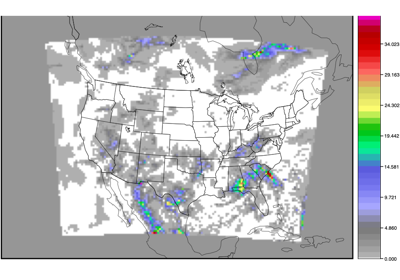
EnsembleStat: Using Python Embedding for Aerosol Optical Depth
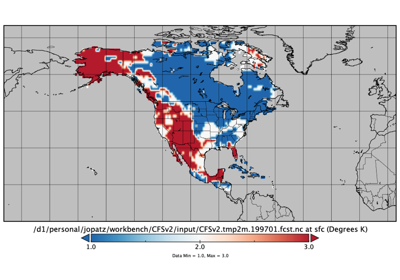
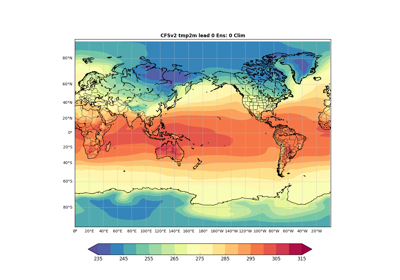
7.2.2. Climate
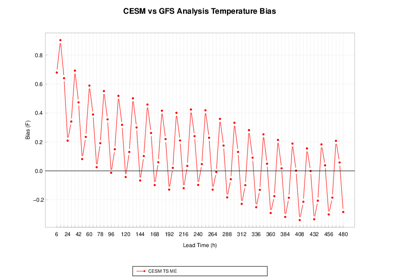
Average long range earth system predictions
7.2.3. Clouds
A category for use cases interested in the composition of, or characteristics associated with, clouds
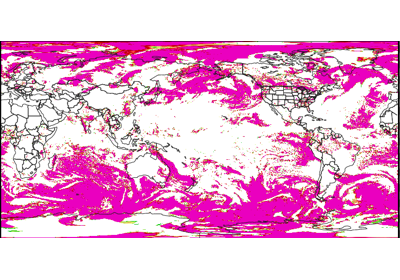
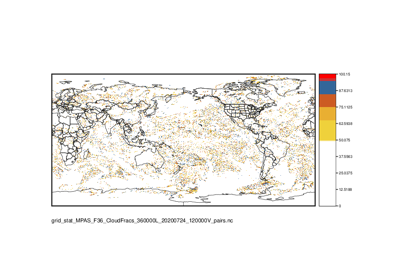
GridStat: Cloud Fractions Using MPAS and SatCORPS Data
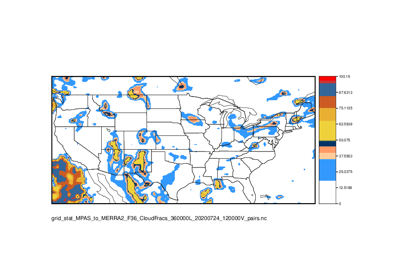
GridStat: Cloud Fractions Using MPAS and MERRA2 Data
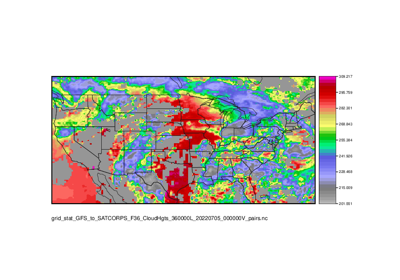
GridStat: Cloud Height with Neighborhood and Probabilities
GridStat: Cloud Fractions Using GFS and MERRA2 Data
7.2.4. Data Assimilation
Observational data used as part of the initial conditions for numerical weather prediction
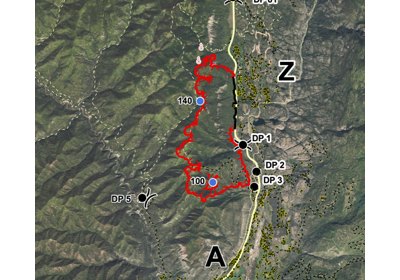
7.2.5. Fire
Verification of fire weather-related atmospheric parameters and fire spread models
7.2.6. Land Surface
Land Model diagnostics and verification against observations
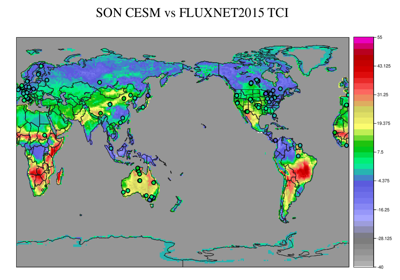
PointStat: CESM and FLUXNET2015 Terrestrial Coupling Index (TCI)
7.2.7. Marine and Cryosphere
Data related to verification involving marine and cryosphere systems, which includes sea-ice
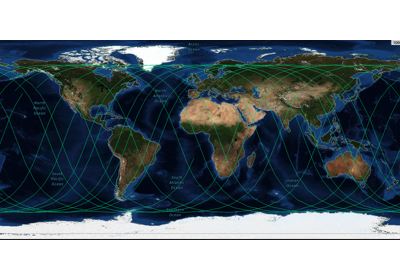
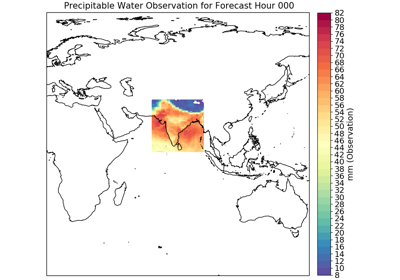
PointStat: read in satellite data and verify wind speeds or wave heights
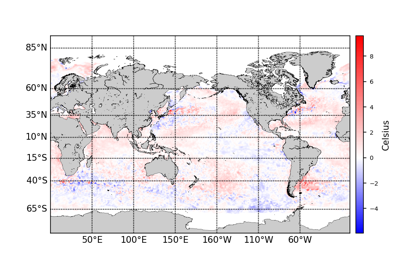
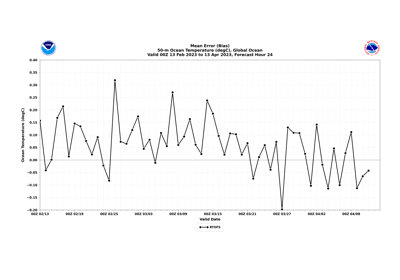
GridStat: Python Embedding to read and process SST
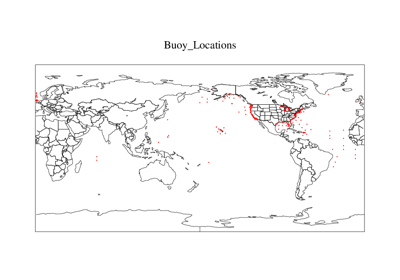
PointStat: read in buoy ASCII files to compare to model wave heights
UserScript: Python Script to compute cable transport
PointStat: read in directory of ASCAT files over user-specified time
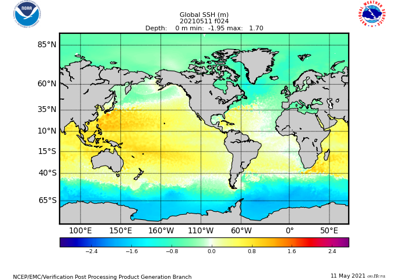
GridStat: Python Embedding to read and process sea surface heights
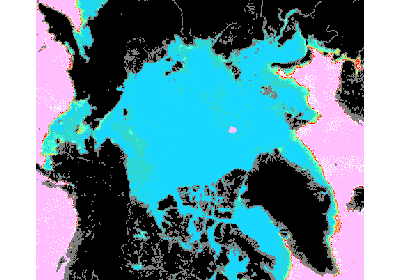
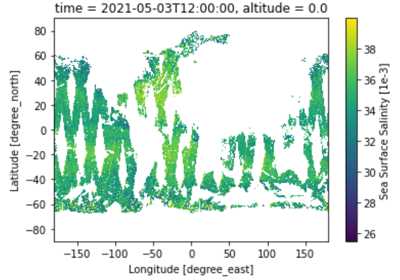
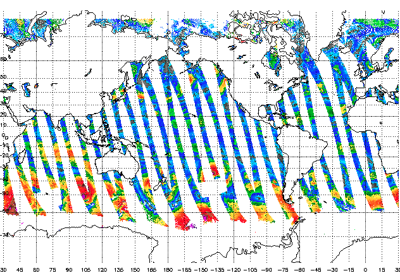
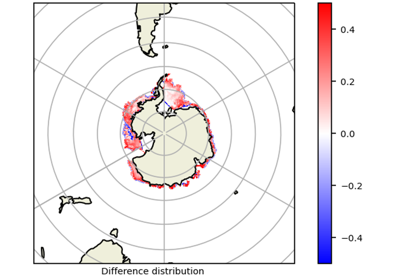
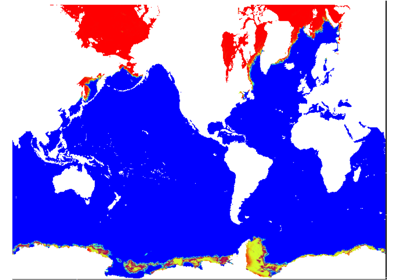
GridStat: Python Embedding for sea surface salinity using level 3, 1 day composite obs
GridStat: Python Embedding to read and process ice cover
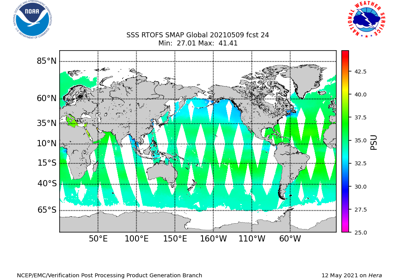
GridStat: Python Embedding for sea surface salinity using level 3, 8 day mean obs
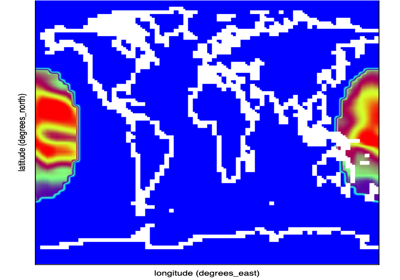
PlotDataPlane: Python Embedding of tripolar coordinate file
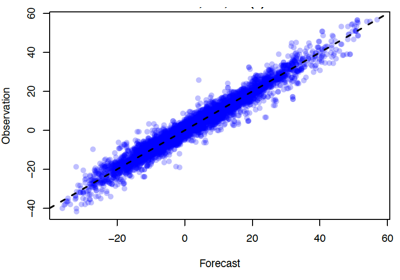
7.2.8. Medium Range
Lower resolution model configuration (>4km) usually producing forecasts out to 7-14 days (also referred to as global models)
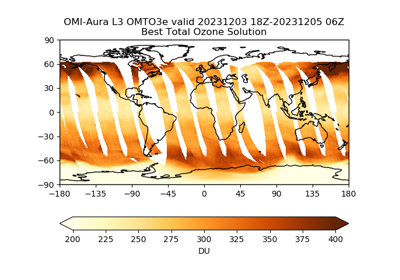
Grid-Stat: Using Python Embedding for Total Column Ozone
Grid-Stat: Compute Anomaly Correlation using Climatology
GridStat: Use binary observation field to verify percentile forecast
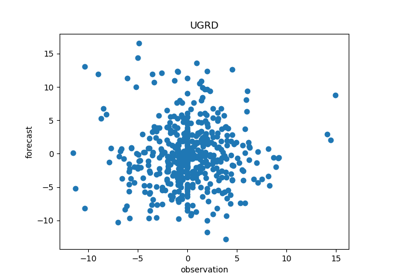
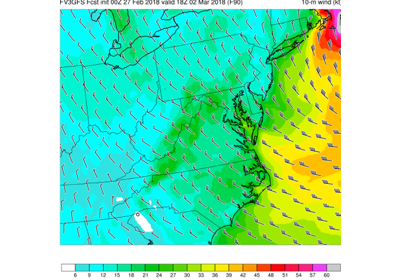
Point-Stat: Standard Verification of Global Upper Air

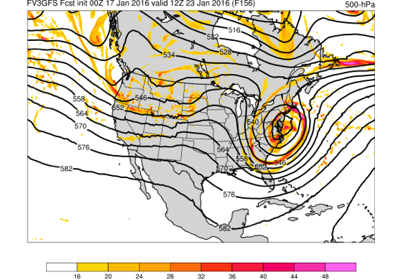
Multi_Tool: Feature Relative by Lead (with lead groupings)
Multi_Tool (MTD): Feature Relative by Lead (with lead groupings)
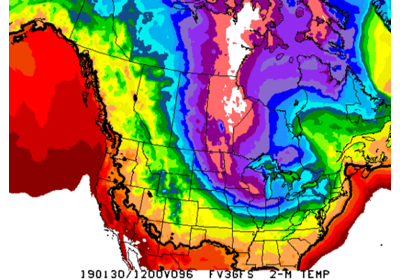
Point-Stat: Standard Verification for CONUS Surface
Multi_Tool: Feature Relative by Lead using Multiple User-Defined Fields
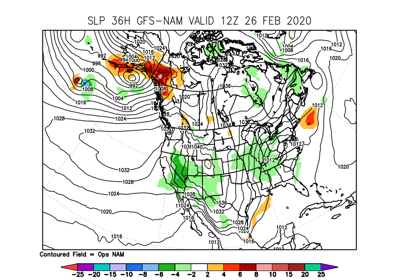
Grid-Stat: Standard Verification of Surface Fields
7.2.9. Planetary Boundary Layer
Planetary Boundary Layer (PBL) applications
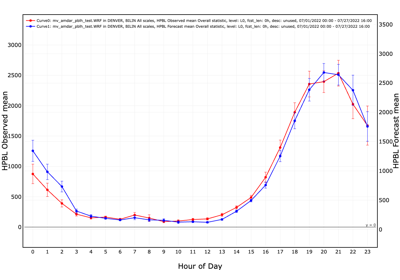
GenVxMask and Point-Stat: Computing PBLH from AMDAR data using “Theta-increase” method
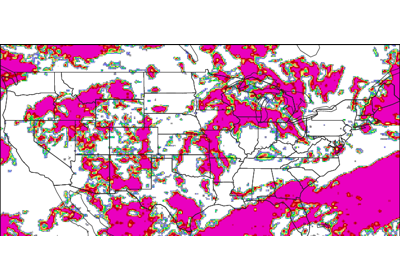
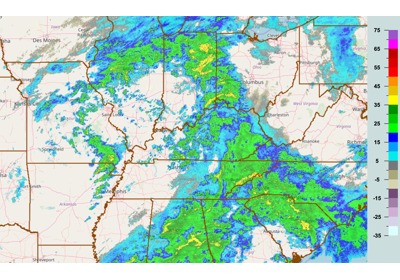
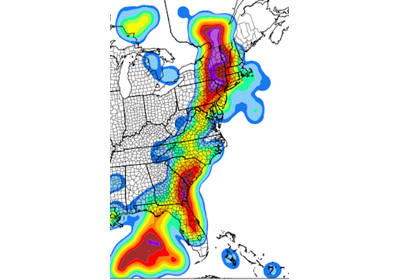
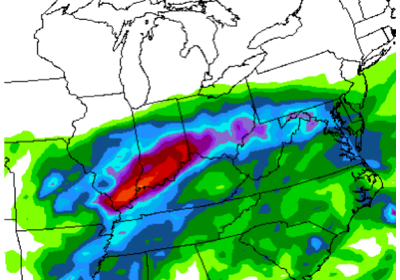
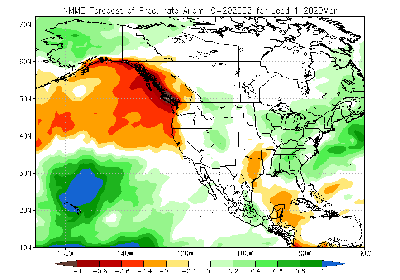
7.2.10. Precipitation
Any fields that can be defined as precipitation, including rain, snow, and other precipitation types
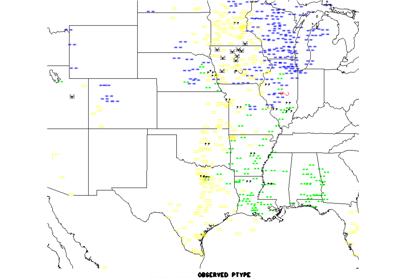
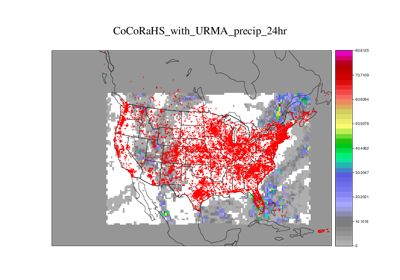
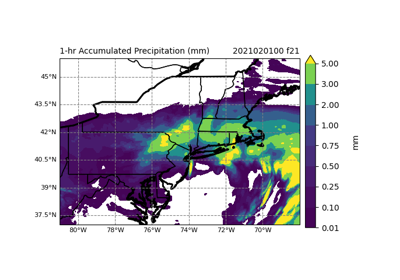
PointStat: Compare community observed precipitation to model forecasts

MTD: Build Revision Series to Evaluate Forecast Consistency
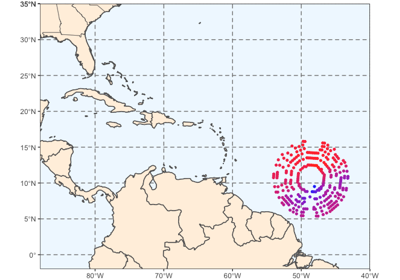
7.2.11. Subseasonal to Seasonal
Subseasonal-to-Seasonal model configurations; Lower resolution model configurations (>4km) usually producing forecasts out beyond 14 days and up 1 year
GridStat: Determine dominant ensemble members terciles and calculate categorical outputs
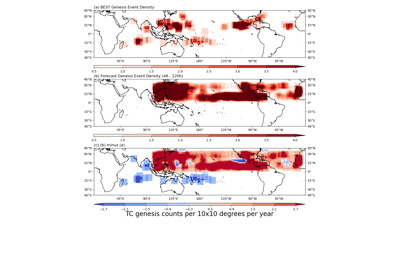
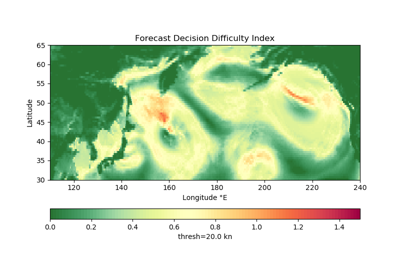
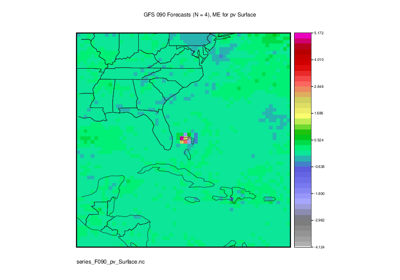
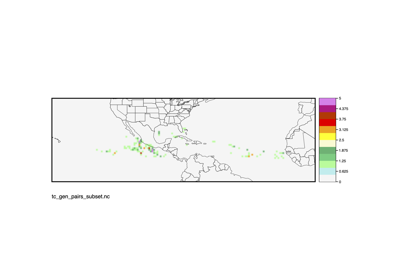
TCGen: Genesis Density Function (GDF) and Track Density Function (TDF)
SeriesAnalysis: Standardize ensemble members and calculate probabilistic outputs
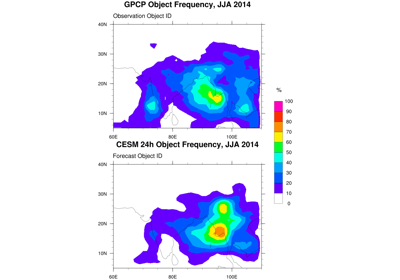
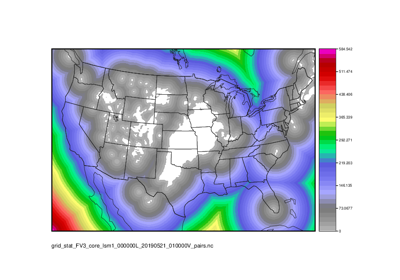
Grid-Stat and Series-Analysis: BMKG APIK Seasonal Forecast
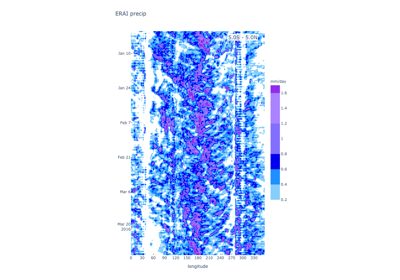
7.2.12. Subseasonal to Seasonal: Mid-Latitude
Subseasonal-to-Seasonal model configurations relating to middle latitudes
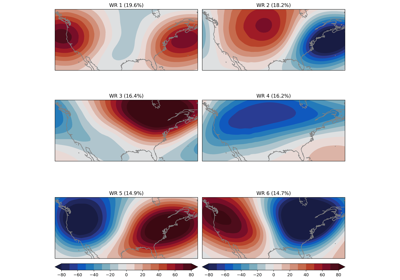
WeatherRegime Calculation: GFS and ERA RegridDataPlane, PcpCombine, and WeatherRegime python code
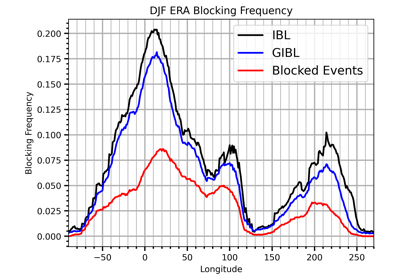
Blocking Calculation: ERA RegridDataPlane, PcpCombine, and Blocking python code
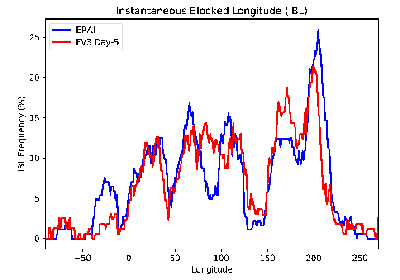
Blocking Calculation: GFS and ERA RegridDataPlane, PcpCombine, and Blocking python code
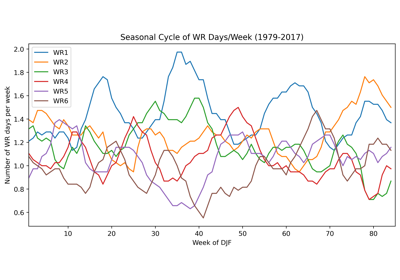
WeatherRegime Calculation: ERA RegridDataPlane, PcpCombine, and WeatherRegime python code
7.2.13. Subseasonal to Seasonal: Madden-Julian Oscillation
Subseasonal-to-Seasonal model configurations relating to the Madden-Julian oscillation
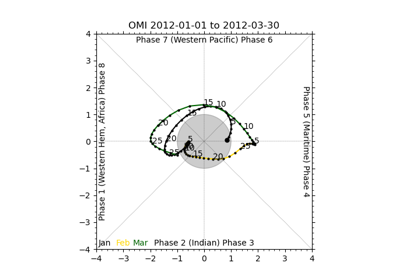
UserScript: Make OMI plot from calculated MJO indices
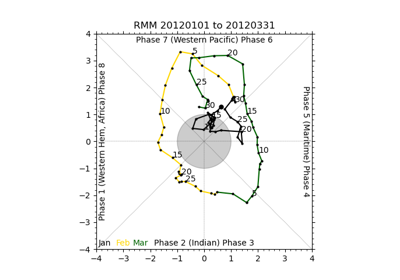
UserScript: Make a Phase Diagram plot from input RMM or OMI
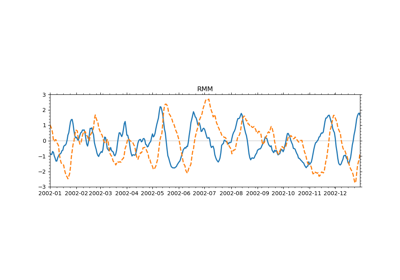
UserScript: Make RMM plots from calculated MJO indices
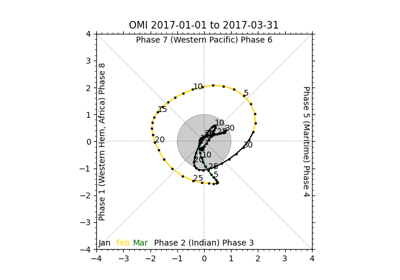
UserScript: Make OMI plot from calculated MJO indices
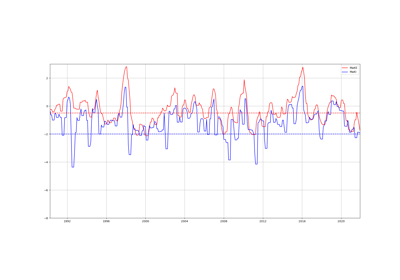
UserScript: Make MaKE-MaKI plot from calculated MaKE and MaKI indices
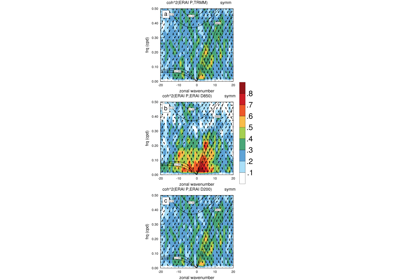
7.2.14. Subseasonal to Seasonal: Stratosphere
Subseasonal-to-Seasonal model configurations for Stratosphere evaluation
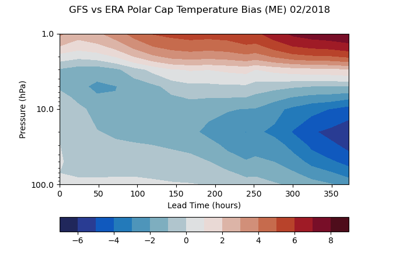
Bias Plot on Polar Cap Temperature and Polar Vortex U: UserScript, Stat-Analysis
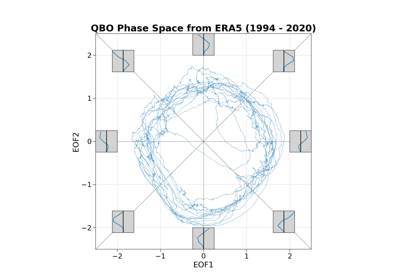
QBO Phase plots and QBO Index: UserScript, Stat-Analysis
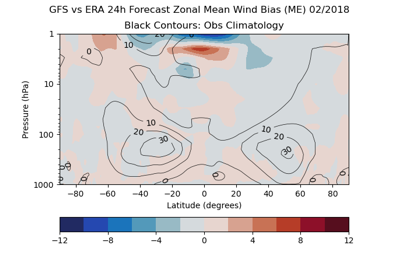
Bias Plot on Zonal Mean Wind and Temperature: UserScript, Series-Analysis
7.2.15. Short Range
High resolution model configurations (1-4km) usually producing forecasts between 0-3 days (also referred to as limited area models, stand-alone regional, and short range weather applications); Previously named Convection Allowing Models
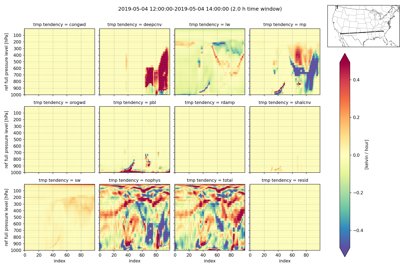
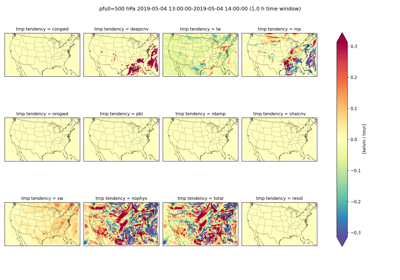
UserScript: Physics Tendency Vertical Cross Section plot
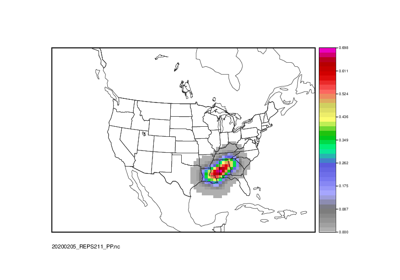
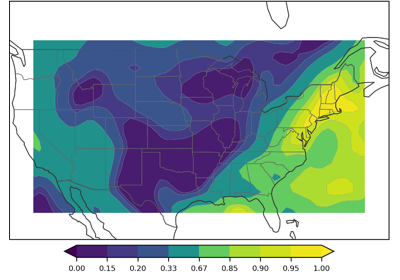
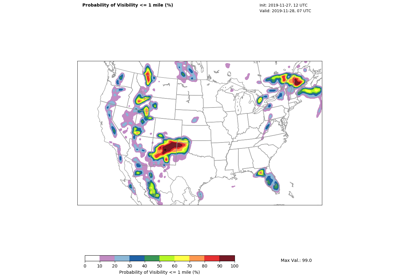
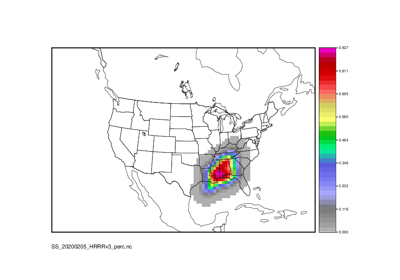
Point2Grid: Calculate Practically Perfect Probabilities
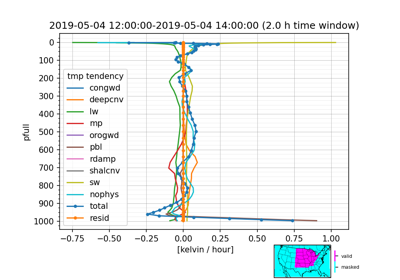
UserScript: Physics Tendency Vertical Profile plot
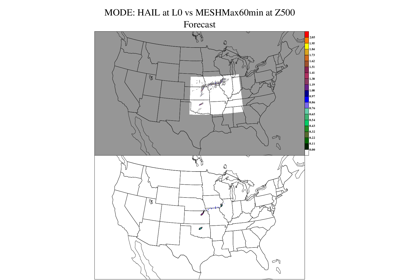
MODEMultivar: Create objects of brightness temps and radar reflectivity
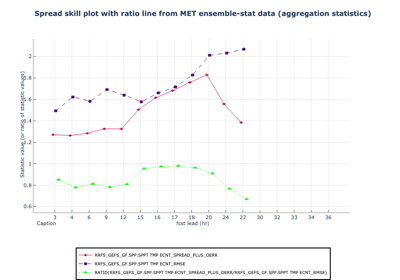
Ensemble-Stat: Ensemble Statistics using Obs Uncertainty
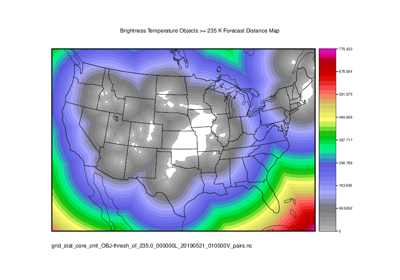
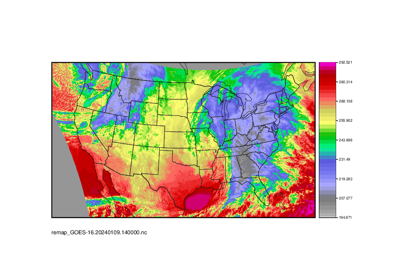
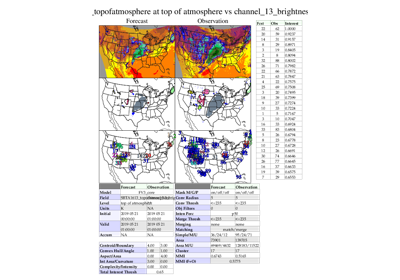
MODE/Grid-Stat: Brightness Temperature Verification and Distance Maps

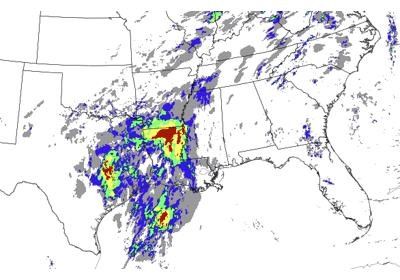
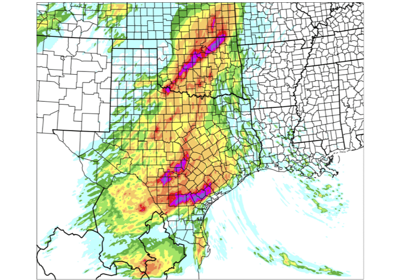
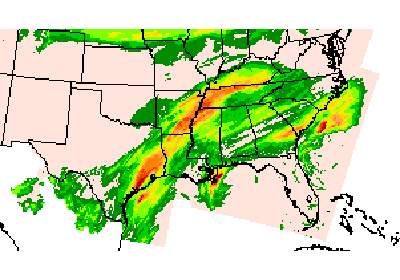
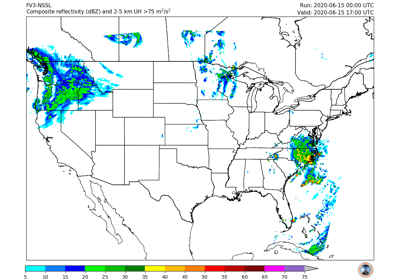
Grid-Stat: Surrogate Severe and Practically Perfect Evaluation
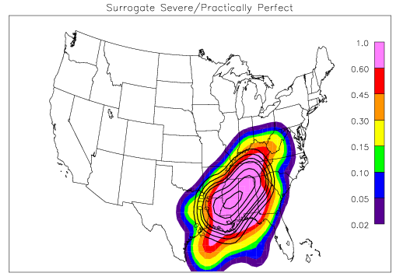
Grid-Stat: Surrogate Severe and Practically Perfect Probabilistic Evaluation
Surrogate Severe Calculation: PCPCombine, GenEnsProd, and RegridDataPlane
7.2.16. Space Weather
Upper atmosphere and geospace model configurations
7.2.17. Tropical Cyclone and Extra Tropical Cyclone
Any field that is associated with Tropical Cyclone and Extra-tropical Cyclones
Point-Stat: Standard Verification for CONUS Surface
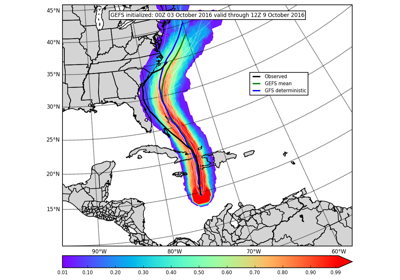
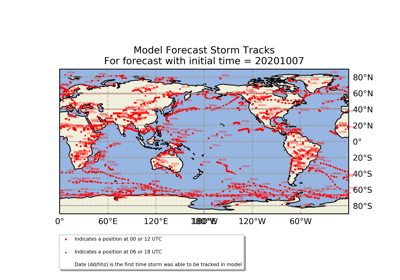
TCGen: 2021 Global Forecast System (GFS) Tropical Cyclone Genesis Forecast
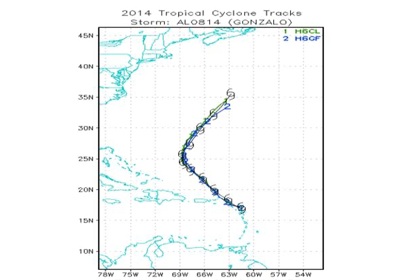

CycloneVerification: TC Verification Compare ADECK vs BDECK
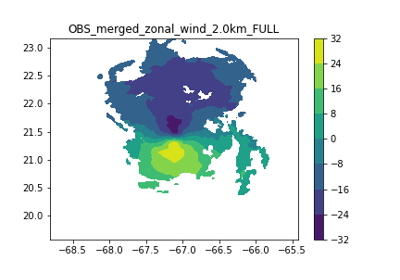
Grid-Stat: Verification of TC forecasts against merged TDR data
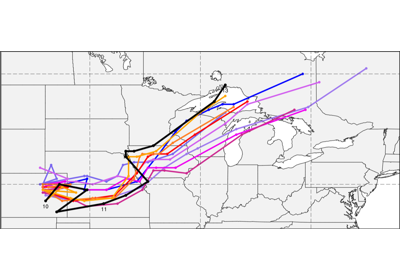
CyclonePlotter: Extra-TC Tracker and Plotting Capabilities
7.2.18. Unstructured Grids
Unstructured grids used by models for numerical weather prediction.